We already wrote about the fantastic news that the Bitcoin price went over $240 per coin. Ever since that happened, the strongest fear for traders was the possibility the cryptocurrency to stumble again and fail to maintain stability over that line. However, two days later the Bitcoin is still valued much more than it was two months ago.
At a time when there have been some bad news for the cryptocurrency and not enough good ones, it’s a real miracle that the Bitcoin is still fighting and improving its value. For example, one of the topics of focus at the G20 meeting in Lima is fighting global tax evasion, something that strongly affects the Bitcoin. Going after Bitcoin companies may prevent start-ups to further develop the currency and its technology. This, inevitably, would slow down or even hurt the spreading of the Bitcoin as a highly used cryptocurrency worldwide.
In any case, both the chart and the technical indicators are promising good days for the Bitcoin and therefore it’s about time to take a closer look at them.
The Lowest Price of the Day is High $241.81
One of the best indicators that things are going well for the Bitcoin and its value is the daily price range. These two numbers that used to be much lower are now both over the $240 line. Believe it or not, but the lowest price of the cryptocurrency for the last 24 hours is $241.81. However, we can notice that the maximum price of the day has fallen to $244.25 in comparison to its value two days ago of $247.26. The current price of a single Bitcoin unit is set at $243.11.
The year to date change today is moving up and down around 22.54%, while the market cap has fallen to $3.41 B. The value is better than the one noted a week ago, when the market cap was less than $3.35 B. In comparison to the numbers seen two days ago, the volatility has fallen as well. Thus, today it’s 19.02%, while it used to be 19.11%. The volume is constantly changing; nevertheless, now it has a value of 29,443.91.
Money Flow Index and Relative Strength Index Note a Fall
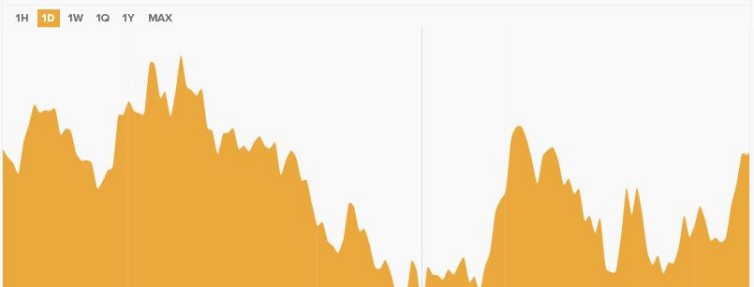
The chart showed that the Bitcoin continued its upward moving direction. However, the 200-day SMA of $245.4864 was too high for the currency to stay above it and therefore fell down to the support line. What the Bitcoin, on the other hand, manages to do is to move around the 38.5& Fibonacci retracement of $243.22. Whether the bulls will note success or not depends on the time the currency will spend over this level.
The MCAD wasn’t affected by the falling max Bitcoin price and thus it jumped a bit to 2.2475. The signal line maintained a strong value of 1.1827, while the histogram calmed at 1.0648. Current value of the momentum is 6.0400, a sign that show buyers are trying to make a move.
Two indicators that noted a fall are the money flow index and the relative strength index. These two used to be 79.3184 and 65.1523, but currently their respective values are 61.1788 and 58.6352.
Knowing all this, we can conclude that two indicators are not promising good days for the Bitcoin, while other two indicators set our hopes pretty high. Therefore, traders might want to wait for some time and see in which direction the cryptocurrency is moving before they open any trades.