We have already predicted that the $300 mark for the price of bitcoin would soon be reached in our last post. However, seeing the cryptocurrency actually going over that threshold is a superb feeling that at the same time amazes and confuses traders.
The question that probably everyone’s been asking since the $300 line was breached is: What happens now?
Obviously, to answer that question we need to make an in depth analysis of the Bitcoin price chart, technical indicators and latest events that somehow affect the Bitcoin price.
Positive Bitcoin News
Since the events related to Bitcoin have been generally positive, it can be said that the currency will probably continue its growth. The United States have announced that it will treat all digital currencies (including Bitcoin) as commodities, while the highest European court declared virtual currencies are exempt from VAT. Additionally, the White House has formed a group that should help law enforcement officials to understand how digital currencies work and improve their reputation. This news is extremely positive for the value of Bitcoin and this will be noticed on the long run.
On the other hand, there’ve been some negative events too. For example, investments into Bitcoin startups have noted a steep fall in Q3 of more than 40%. Additionally, the Russian Finance Ministry proposed prison time with duration of four years for Bitcoin users. This can certainly hurt the cryptocurrency’s reputation and negatively affect its price.
Chart and Indicators Advise Traders to Buy
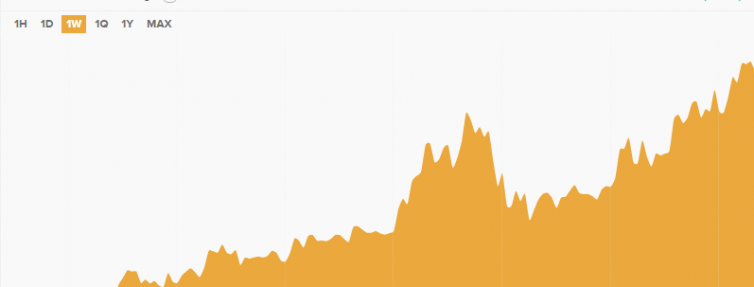
Only a quick look at the chart and the technical indicators for today gives you the impression that the rise of the Bitcoin is not going to stop. The first thing that everyone notices is, of course, the current trading price of excellent $300.22. Taken into account the fact that only three months ago the Bitcoin was under $200, it’s a really amazing progress we see here.
The day range is also noting some pretty impressive numbers; the daily low is over $285 ($285.81), while the highest price of the day is $302.39. The jump has affected the year to date change, which fell to -4.33%. The market cap, on the other hand, has noted a growth and went over the $4 B mark, reaching $4.22 B. Unlike the volatility that seems stabilised between 17% and 18%, the volume is constantly growing and currently is set at 81,140.83.
The technical indicators also show positive movements. The 14-day RSI reached a value of 67.931, while the MACD has gone deep in the positive territory reaching 2.880. The Bull/Bear power has a value of 4.3340, whereas the ROC calmed at 2.746. The strong buy indicator is further highlighted with the moving averages. For instance, the 50-day, 100-day and 200-day SMAs have respective values of $287.00, $283.06 and $275.31.
The intraday support level is set at $275, while the intraday resistance level is set at $317. Thus, don’t forget your stop loss orders. Additionally, bulls might want to wait before opening large long positions and all traders should keep in mind that some of the indicators have entered the oversold area, a scenario that could result with a drop of the Bitcoin’s value.