The beginning of yet another week brings both positive and negative news related to the Bitcoin; for example, the price didn’t make a notable jump as it was expected, but it also didn’t fall below $440 either. Therefore, we can conclude that the cryptocurrency has regained stability again and all further trading actions should be taken very carefully.
When it comes to events and analyses worth reading, we would strongly suggest a reality check on TechChurch for Bitcoin enthusiasts that believe the currency could help the poorest. The article explains that the lack of infrastructure and acceptance of Bitcoin are some of the reasons that prevent the cryptocurrency of becoming a useful tool for storing and transferring funds for the unbanked (people that don’t own a bank account).
Good news came from India, one of the world’s largest markets, where a Bitcoin start up company called Zebpay managed to raise $1 million in VC funding. This shows that the country, which reportedly has around 50,000 Bitcoin enthusiasts, is slowly opening its doors to digital currencies. Ever since it was launched, Zebpay has been seeing a 100% monthly growth and the Bitcoin mobile wallet has been constantly expanding its services.
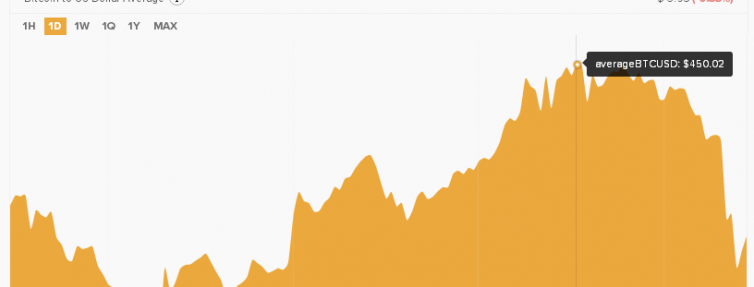
Price Chart Overview
The current trading price of the Bitcoin is $446.110, while last Monday it was lower $430. Plus, if you check the 52 week price range that starts at $425.449 and goes up to $464.400, you can see that this value belongs somewhere in the middle; it’s neither too bad nor too good. Obviously, we still hope to see the expected 2016 growth; nevertheless, as long as the Bitcoin doesn’t fall, traders should be happy.
In the past hours the price per Bitcoin reached a daily high of $452.62 and then it fell at $446.004; the latter is also the day’s low for the time being. Therefore, the daily change for now has been around $5 in the negative.
The market cap is still strong with a value of over $6 B; currently its exact value is set at $6.68 B. This Monday morning we can see a relatively low 24-hour trading volume of 7,547; this number is partly consistent with the signal received from technical indicators that the price is going to drop.
Indicators Say Price Might Fall
Knowing that the US Dollar is doing well these days and it even might grow, it shouldn’t be surprising that experts expect to witness at least a slight price drop of the Bitcoin. As we mentioned in the previous paragraph, the volume is not that high, plus as you’ll see below most indicators and averages are signalling traders to sell.
Five out of 11 indicators in total are pro-sell, whereas four are pro-buy. Therefore, this signal shouldn’t be the main reason why you decide to sell or buy since it’s almost neutral. Moreover, the buy signal of the STOCH (60,348), MACD (0.390) and ROC (0.349) is pretty strong.
The moving averages, on the other hand, have a much clearer signal with nine out of 12 values suggesting that traders should sell. The averages that are pro-buy are the 100-day EMA, 200-day SMA and 200-day EMA.
With the intraday support level at $440 and the intraday resistance level at $460, it’s smart to open traders only when you’re 100% aware that there might be a price drop just like there could be a growth in value. It’s still early to predict how the Bitcoin will behave during 2016’s first month, especially since there haven’t been any extremely notable events yet.