January has passed and alongside the beginning of a new week we have the beginning of a new month as well. However, this transition hasn’t brought something interesting at out doorsteps; on the contrary, we can say that it’s been pretty eventless in the Bitcoin world.
The end of the last week was accompanied by interesting news and even though not all of them were positive, at least something was happening. Today, we don’t have anything to point out as entertaining or important except for the obvious price drop. Point by point, the Bitcoin is losing on value with each passing week. Strongest fans need much more before they give up on their favourite virtual currency, but sceptics are starting to worry.
Because of the lack of Bitcoin related news, today’s post will be focused on the price, its latest movements and some tips. Generally, the situation is far from idyllic and if there isn’t a positive change soon, we might have enough reasons to start doubting that the cryptocurrency would get back on its feet.
Bitcoin Trading for $375 per Coin
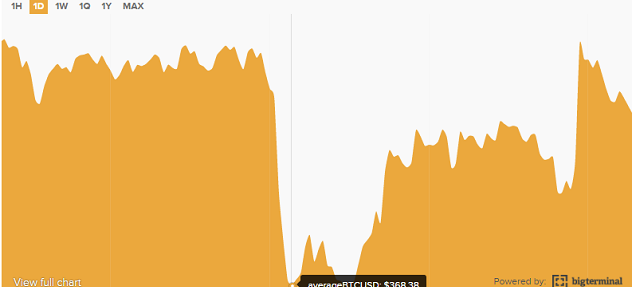
Our price chart reveals a pretty negative situation for the cryptocurrency. Instead of finally to move into a positive direction, the Bitcoin further fell. Last week it’s trading worth was set around $382, whereas today it’s trading for much lower $375.70. The day’s low is $368.34, which reveals that the cryptocurrency has fallen below $370 once again. The day’s high, on the other hand, is $378.47; note that the Bitcoin has lost so much power that it’s unable to even go over the $380 mark.
The volatility is still over 60%, settled at 60.42%. This is a pretty same situation as the one we saw last week when the volatility was a bit higher 63.39%. The market cap has dropped as well. On Friday its value was $5.80 billion, but this first Monday of February, 2016, it’s settled at $5.70 billion. The 24 hour volume is a bit over $51,199,400 or 5,794. These numbers place the 24-hour change percentage in the negative 0.76%.
Technical Indicators and Moving Averages Overview
Not surprisingly, the technical indicators and the moving averages are not too positive when it comes to Bitcoin’s future; at least for the near one. Even with a positive buy signal, the Bitcoin is continually falling, let alone with this strong sell signal.
Let us first take a look at the technical indicators where five are pro-sell, three are pro-buy and three are neutral. The 14-day RSI is one of the neutral indicators with its value of 46.085. On the other hand, the MACD, even in the negative 0.550, recommends traders to buy. Bull/bear power, ROC and ultimate oscillator are some of the indicators that signal traders to sell.
The moving averages are pretty extreme since every single one of them is pointing out selling as the best option at the time. The lowest value that can be seen among the simple and exponential moving averages is 5-day EMA’s value of $377.80.
With the current values on both the chart and among the indicators, we can place the intraday support level at $365 and the intraday resistance level at $375. We advise you to be very careful and expect further price drops. Even though some experts are hopeful that the price might soon start growing, we would wait until that happens before investing large amounts in the cryptocurrency.