Well, if you listened to what technical indicators were signalling on Wednesday, then you’ve probably made the right choice to buy some Bitcoins whose worth has now improved. That’s right, in only two days the Bitcoin’s value went several points up and breached the $430 threshold.
Even though the positive movement of the price is what interests traders the most, the wider public is still focused on the possible unmasking of Satoshi Nakamoto. There’ve been divided opinions whether Wired and Gizmodo published false evidence that Craig Steven Wright was really the person that invented Bitcoin or not. The story actually reached many popular newspapers and portals worldwide as well as attracted lots of attention from both Bitcoin fans and opponents.
The Verge revealed that pointing out Wright as Satoshi Nakamoto was part of an extortion scheme, whereas The Washington Post offered some other individuals that could actually be the real Nakamoto. Part of their thesis includes an analysis of the language used in Satoshi’s blog posts, which was described as “flawless English.” Reportedly, Nakamoto was using British spelling and phrases that are commonly used in the Kingdom. Thus, the paper suggest that Satoshi Nakamoto is likely someone that comes from the UK instead of Japan or Australia.
Bitcoin Price Chart Overview
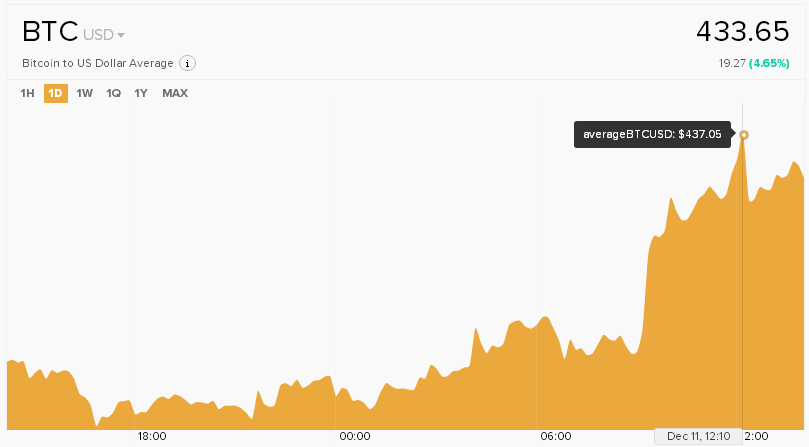
It’s always great to write about increase of Bitcoin’s value. The cryptocurrency has been growing for quite some time now and it constantly reaches new highs. On Monday it almost hit $400 and noted the highest price in the past 30 days; on Wednesday it hit the $420 line and today we can see it over $430.
The current trading price of the virtual currency is $433.79 and the day’s lowest price is over $400 i.e. $409.5. The highest price the Bitcoin reached in the past 24 hours is hopeful $437.35. Not surprisingly, such numbers caused the year to date change to jump to 38.24% and the market cap to go over $6 B ($6.1 B).
In the past several weeks the volatility first fell under 17% and then under 16%. However, the positive movement caused it to go up a bit and its current value is 16.61%. The trading volume has been constantly changing towards the positive. Hence if it was around 40,000 several hours ago, now it’s over 72,000.
Further Price Growth is expected?
Rarely the technical indicators and the moving averages give us the wrong signal and, taken into account today’s “Strong buy” recommendation, we believe there will be another price growth over the weekend. The only reason to not take these numbers for granted are the STOCHRSI and the Williams %R that signal the Bitcoin is being overbought and thus might drop.
A total of nine indicators say that this is the right time for traders to invest in Bitcoin. For example, the 14-day RSI has a good value of 71.733, while the ROC is 3.790. Similarly, other pro-buy indicators are the MACD (3.970), the ultimate oscillator (68.781) and the highs/lows (8.3574). When it comes to the moving averages, 12 out of 12 signal traders to buy. All of them have values under $428, with the 200-day SMA and EMA being the lowest at $387.28 and $392.02 respectively.
With all this noted, we can place the intraday support level at $400 and the intraday resistance level at $440. Hopefully, we will soon see the $440 line breached or, at least, we can wish to see the price stabilised between $440 and $430.