Crypto investors and fans are always trying to guess the price today, tomorrow, or in the long run. More experienced crypto investors, though, stick to other metrics that try to predict things like the bottom of a bear market. Which is easier said than done. Building an accurate model for these kinds of metrics is challenging, and until recently, models could find the top or bottom of a bear market with relative accuracy.
Luckily, Glassnode’s experts have developed a new drilling model that had a 100% hit rate in tests. Known as the drilling method, it can predict the bottom of a bear market with almost pinpoint accuracy. Created by prominent Bitcoin investors Trace Mayer, Glassnode has used the drilling method on the latest bear market run, and it’s good news – it should be close to an end.
The Mayer Multiple
Trace Mayer is the creator of the so-called Mayer Multiple model that has been used to accurately predict Bitcoin’s price over a 200-day moving average. More specifically, the Mayer Multiple has been used to predict if Bitcoin is in a bubble or in the clear. However, Mayer recently discovered that the model can be re-adjusted to predict the top of a bull market if the multiple is at 2.4. A multiple below 1 indicates a bear market.
Experts now believe that a multiple higher than 2.4 shows that Bitcoin is overbought and that buyer exhaustion is near. By taking this metric, the current price, and the percentage of Bitcoin in circulation, Glassnode identified where Bitcoin currently stands in this market cycle. The model was used in previous market cycles between 2010 and 2022, and predicted the bottoms of bear markets with pinpoint accuracy. Not surprisingly, the market is in bear territory right now, which typically lasts for 6-12 months. Luckily, we’re currently on or near the bottom of this cycle as the bear market started in mid-June.
Additionally, whales have been stockpiling BTC for a while now, probably getting ready for what lies ahead.
Good Times Ahead?
Here’s hoping this rings true. The prediction agrees with similar bottom indicators including the weekly RSI, the Bitcoin Rainbow Chart, and the 50-week/100-week moving averages. Of course, this isn’t real science so there’s a possibility everything’s wrong and the bear market stays locked in for a long time.
Given the world’s financial difficulties, the increasing interest rates, a global stock market on the brink of collapse, and the Russia-Ukraine war that’s been escalating in recent weeks, a bull run may be pretty far away. On the other hand, Bitcoin’s volatility is highly unpredictable, and a new bullish wave can begin at any time.
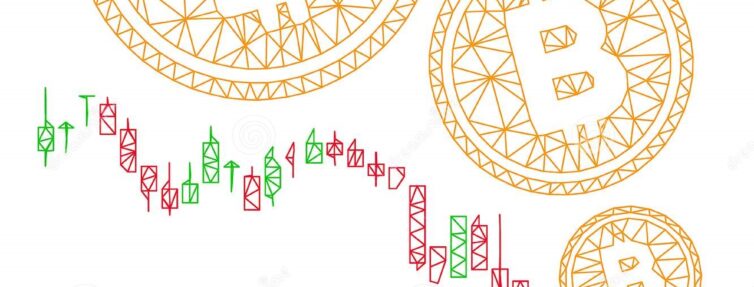
At the moment, Bitcoin just suffered another drop below $20,000, currently holding on to a slim $19,000. Resistance is around $19,420, and it’s pretty bulletproof. The next support area is in the $16,000 range, and many experts believe that the worst is coming soon before things take a turn for the better.